|
This document describes the one-dimensional model used to represent the heat flow between the conditioned zone and the outdoors through the portion of the ceiling insulation, along the outside edge of the attic, through which the heat flows to the outdoors without passing through the attic air. This portion will be modeled in CSE as cathedral ceilings, and is referred herein as the roof edge. The rest of the heat flow path through the ceiling insulation will be modeled as part of the attic zone, and is not discussed here.
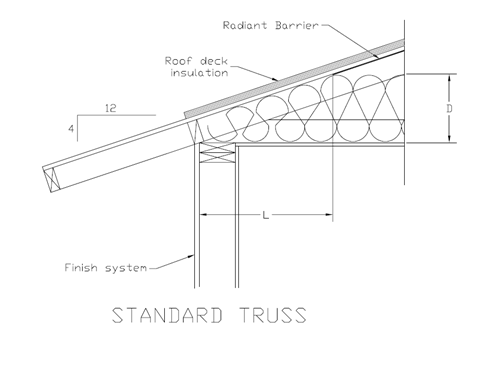
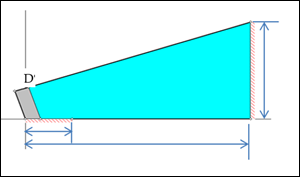
Two types of roof construction are considered, standard-heel and raised-heel trusses, shown in Figure 26 and Figure 27, with the geometries assumed to be representative of current practice. The roof trusses are assumed to be framed with 2x4’s. Although the figures are for a roof with a 4-in-12 pitch, the 1-D model will handle any standard pitch. The distance between the wall plate and roof deck (shown, for example, as 12 inches in Figure 27) is also not restricted to the distances implied by Figure 26 and Figure 27.
The 1-D model is developed in order to simplify the heat transfer calculation for roof edges, while preserving the steady state and transient characteristics (layer mass) of the typical roof constructions addressed. The 1-D model produces the dimensions of the construction layers needed to represent the roof edges.
Figure 26: Standard-Heel Geometry
L![]()
![]()
L and D determine where the top of the ceiling insulation meets the roof deck plane.
Figure 27: Raised-Heel Geometry
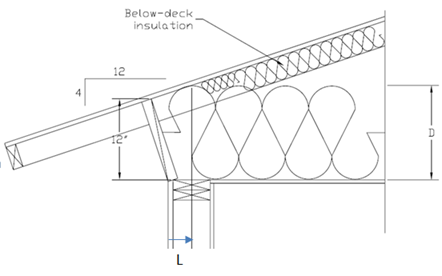
L and D determine where the top of the ceiling insulation meets the roof deck plane.
Using the parallel path method, the heat transfer is determined separately for the insulation and framing paths of the constructions.
First consider modeling the standard-heel truss of Figure 26.
For the path through the insulation, Figure 26 is
approximated as the simpler 2-D configuration of Figure 28 and Figure 30, with
the left vertical edge assumed to be adiabatic and of height left side
tilted edge board in Figure 26, the ceiling is assumed to extend to the outer edge of the vertical
wall.
left side
tilted edge board in Figure 26, the ceiling is assumed to extend to the outer edge of the vertical
wall.
The width, WA of roof edge path A, is taken as the width of the vertical path of solid wood in the framing section view of Figure 30.
Figure 28: Standard-Heel Simplified Geometry for Insulation Path
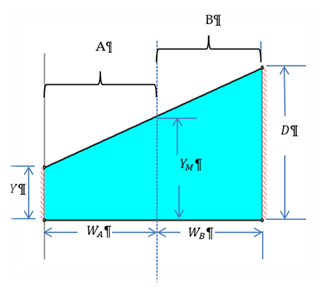
Figure 28 is then reduced to the 1-D form shown in Figure 29, where the layer thicknesses are taken as the average height of the layer in Figure 28.
Figure 29: Standard-Heel 1-D Geometry for Insulation Path

The left hand portion represents the insulation path of the 1-D model of roof edge A. The right side represents the insulation path of the 1-D model of roof edge B.
The 1-D model just considers the ceiling insulation and framing. When implemented as part of a cathedral ceiling in CSE, a sheetrock layer would be added to the bottom of Figure 29 paths. Layers added to the tops of the layers in Figure 29 would be decking, asphalt shingles, and tile, for example.
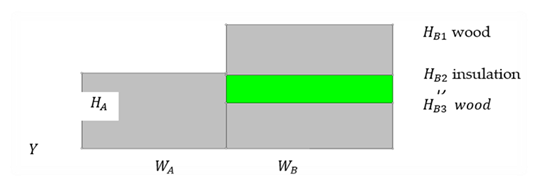
Similar to the insulation path, the framing heat transfer path starts with Figure 30, which is reduced to Figure 31. The widths of A and B are the same as for the insulation path figures HB1 and HB3 are the vertical thickness of the 2x4’s and HB2 is the average thickness of insulation.
Figure 30: Standard-Heel Simplified Geometry for Framing Path
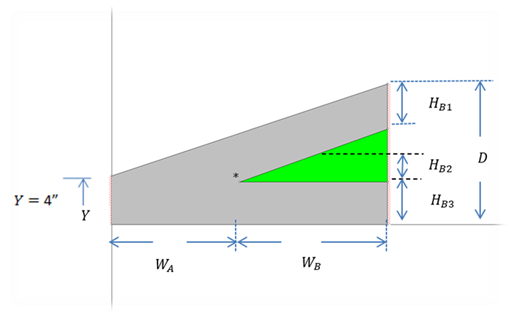
 Figure 31: Standard-Heel 1-D Geometry for Framing
Path
Figure 31: Standard-Heel 1-D Geometry for Framing
Path
The 1-D model for the raised-heel case of Figure 27 is different than for the standard-heel case of Figure 26. The geometry is illustrated in Figure 32 and Figure 33 for a ceiling insulation of R38.
As the edge height, Y, in Figure 30 is increased, the deck and ceiling 2x4’s separate vertically near the roof edge, and a vertical 2x4 is assumed to fill the gap. That is, as Y is increased, the standard truss geometry of Figure 28 and Figure 30 morphs into the raised truss geometry of Figure 32 and Figure 33. The 1-d roof edge algorithm below, gives the layering outputs for both the standard-heel truss and the raised-heel truss and everything in between.
Figure 32: Raised-Heel 1-D Insulation Path Geometry

Figure 33: Raised-Heel 1-D Framing Path Geometry

HB1 , and HB3 are the vertical thickness of the 2x4’s and HB2 is the average thickness of insulation.
The following algorithm, written in succinct pseudo-code form, determines the layer widths and thicknesses for roof edge paths A and B. [This algorithm is implemented in RoodEdgeAlgorithm-1.xlsx].
All dimensions are assumed to be feet.
Input:
Y = edge height, ft.
w = framing width, ft. [nominally (3.5/12)-ft]
Rtot = total R value of ceiling insulation, hr-ft2-F/Btu.
Rperin = R value of the ceiling insulation for one inch thickness, hr-ft2-F/Btu.
P = pitch = rise/12
Calculation of  :
:

insulation depth, ft

vertical thickness at position x=X_I
 horiz distance from
left edge to intersection of deck and ceiling 2x4’s (see * in Figure
30). In Figure 33, the corresponding point would be
outside the roof section, and near the left edge of the page, and as opposed to
the * point, this
horiz distance from
left edge to intersection of deck and ceiling 2x4’s (see * in Figure
30). In Figure 33, the corresponding point would be
outside the roof section, and near the left edge of the page, and as opposed to
the * point, this  will is a negative number since
it is to left of origin at outside surface of top wall plate.
will is a negative number since
it is to left of origin at outside surface of top wall plate.
IF
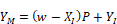
YM=YI YM is the height of roof section at the vertical line between A and B.
ELSE 
END IF
IF


IF

ELSE

END IF
ELSE IF


ELSE (D ≤ Y)

END IF
The roof edge heat transfer is basically a 3-D problem. The 1-D model makes a number of simplifications. For example, the parallel insulation and framing path assumption ignores lateral heat transfer between the insulation and framing path, and leads to an underestimation of the overall heat transfer. The assumption of an adiabatic right hand border, where in reality the heat flow lies are not quite vertical, also underestimates the heat transfer through the cathedral ceilings with an accompanying overestimation of the remaining heat transfer through the attic portion of the ceiling insulation. The assumption of the layer thicknesses taken as the average layer thickness ignores 2-D effects. The complicated 2-D heat transfer at the junction of the vertical wall and roof is simplified by assuming the left border is adiabatic, and the ceiling continuation to the outside of the wall. Corner effects for the roof edge, where vertical walls meet at right angles, results in a 3-D heat flow situation that can only be estimated.
Because of these complexities, it is difficult to assess the accuracy of the 1-D model.
However, in order to obtain some perspective on the accuracy of the 1-D model, the heat transfer was calculated for two cases, of different insulation depths, using both the 1-D roof edge algorithm, and a 2-D (using FEHT finite-element program) solution with the roof edge 2-D geometry of Figure 26. The 2-D model still requires many of the assumptions made in the 1-D model, including the parallel path assumption.
Using the 1-D Roof Edge Algorithm, the heat transfer rates through roof edges A and B was calculated for the following inputs.
Input to Roof Edge Algorithm
 hr-ft2-F/Btu.

Y = 0.3333 ft
w = 0.2917 ft
Rperin = 2.6 hr-ft2-F/Btu.
Output of Roof Edge Algorithm
WA = 0.797 ft
WB = 1.087 ft
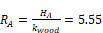
HA = 0.466 ft
HB = 0.780 ft
HB1 = 0.292 ft
HB2 = 0.182 ft
HB3 = 0.307 ft
Insulation Path Results
The insulation conductivity is

The thermal resistance of A and B are:
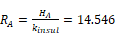 2-F/Btu
 2-F/Btu
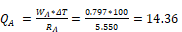
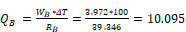
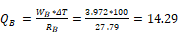
If no additional layers are added (sheetrock, etc.), and the top and bottom surface temperature difference is 100 F, the heat transfer rate in this case, per foot of roof perpendicular to the section, becomes:
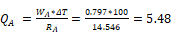
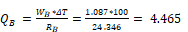
The total is:
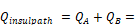
Framing Path Results
Assume wood framing conductivity k = 0.084 hr-ft-F/Btu.
The thermal resistance of A, per foot of roof edge perpendicular to the section:
 2-F/Btu
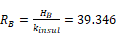
The thermal resistance of path B; sum of layer resistances:
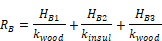
= 3.66+5.654+3.473 = 12.786 hr-ft2-F/Btu
The sum of the heat transfers in this case is (from CathedralWorksheet.xlsx).

Qframingpath =QA+QB = 22.86 Btu/hr-ft
Input to Roof Edge Algorithm
Rtot = 60; other inputs the same as in Rtot = 30 case above.
Output of Roof Edge Algorithm
WA = 0.797 ft
WB = 1.087 ft
HA = 0.466 ft
HB = 0.780 ft
HB1 = 0.292 ft
HB2 = 0.182 ft
HB3 = 0.307 ft
Insulation Path Results
Similar to the Rtot = 30 case, the thermal resistance of A and B are:
hr-ft2-F/Btu
hr-ft2-F/Btu
The heat transfer rates are:


Btu/hr-ft
Framing path results
The thermal resistance of A, per foot of roof edge perpendicular to the section:
hr-ft2-F/Btu
The thermal resistance of path B is the sum of layer resistances. k = 0.084 hr-ft-F/Btu is assumed.
 2-F/Btu

The sum of the heat transfers in this case is:

Qframingpath = QA+QB= 28.65 Btu/hr-ft
Insulation Path
The Figure 26 case is modeled with the simplified geometry of Figure 30 shown for a ceiling insulation of R30. The top of the plate capping the vertical wall is assumed to be adiabatic. The tilted block assumed to be wood, exposed to ambient conditions on its outside sides. The outside of the wood and insulation assumed to be at a uniform 100F. The ceiling side of the insulation is set to at 0 F. The same material properties were used as in the 1-D model.
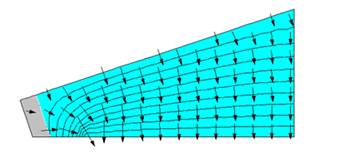
Figure 34: Standard Truss, Insulation Path, 2-Dimensional Heat Transfer Model Geometry
The resulting isotherms and heat transfer vectors are shown in Figure 35.
Figure 35: Standard-Heel, Insulation Path, 2-Dimensional Heat Transfer Isotherms and Heat Transfer Vectors
The overall heat transfer, per foot of perimeter, for this case was determined (RUN std30.FET) to be:
Equation 229
Q = 9.67 Btu/hr-ft
Framing Path
The frame path was modeled similarly, with the Figure 36 graphic results.
Figure 36. Standard-Heel, Frame Path, 2-Dimensional Heat Transfer Isotherms and Heat Transfer Vectors
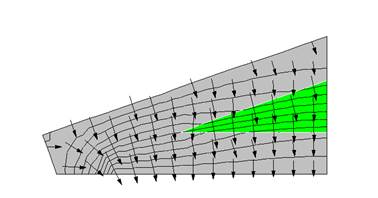
The overall heat transfer, per foot of perimeter, for this case was determined (RUN std30F.FET) to be:
Equation 230
Q = 21.94 Btu/hr-ft
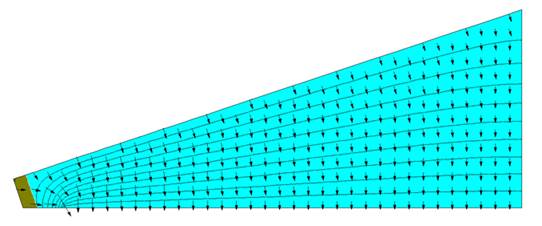
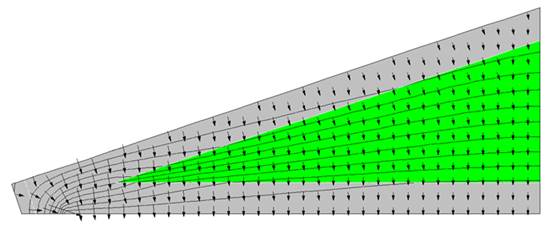
Similar to the R30 case above, Figure 37 and Figure 38 show the insulation and framing path 2-D results.
Figure 37: 2-D Results for Insulation Path of R-60 Standard-Heel
.
The overall heat transfer, per foot of perimeter, for this case was determined (RUN: std60.fet) to be:
Equation 231
Q = 16.342 Btu/hr-ft
Figure 38: 2-D Results for Framing Path of R-60 Standard-Heel
The overall heat transfer, per foot of perimeter, for this case was determined (RUN: std60F.FET) to be:
Equation 232
Q = 31.543 Btu/hr-ft
The above 2-D results are compared with the simplified 1-D model in Table 8.
Table 8: Comparison of 1-D and 2-D Results
|
|
R30 ceiling insulation |
R60 ceiling insulation | ||
|
|
insulation path |
framing path |
insulation path |
framing path |
|
|
9.94 |
22.86 |
15.57 |
28.65 |
|
|
9.67 |
21.94 |
16.34 |
31.543 |
|
|
|
|
|
|
Because the 2-D model used is itself of limited accuracy considering the numerous approximations made, the above results are not considered to be definitive. However they do indicate that a number of the assumptions made in the 1-D model are reasonably accurate. While this comparison is limited to steady state heat transfer performance, mass effects are expected to have comparable accuracy.