The California Energy Commission is adding a self-utilization credit for residential battery systems to its residential building energy efficiency standards for 2019. Under the new standards, a residential battery paired with an on-site photovoltaic (PV) system should receive fair credit toward the building’s Energy Design Rating (EDR) score. This document aims to be a consideration of how the CBECC-Res 2019 compliance software will produce the battery EDR credit: what the current implementation is and what steps might be taken to improve the implementation.
Whereas most energy upgrades reduce energy use in a house, battery systems actually increase electricity consumption in exchange for some shaping of the load. A 14-kWh battery, with a 90% round-trip efficiency, that cycles 13 of those kWh 300 times a year, will consume 4.1 MWh of electricity and discharge 3.7 MWh of electricity per annum. But by charging when there is excess PV production and discharging when PV production is low and electricity is expensive, the battery both saves money for the residence and provides value to the electricity system overall. Thus, the EDR self-utilization credit must account not for energy savings, but for savings in value-of-energy.
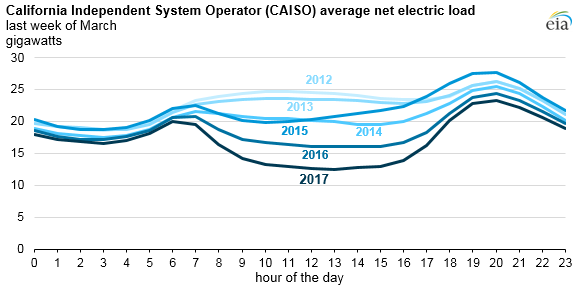
Distributed electric storage can provide value to the electricity system overall through load shaping and other behaviors. Bolstering demand during low periods helps to leave efficient plants running full time and reduces ramping requirements. Reducing peak demand helps in a number of ways, including by allowing expensive peaker plants to remain idle more days of the year. In recent years, a growing electricity contribution from solar generation has resulted in what many in California have termed the duck curve (see Figure 1): a dip in net electric load between the morning and evening peaks. Batteries, by filling in the midday trough and shaving the evening peak, can be part of the remedy for a worsening duck curve.

Figure 1: An illustration of how increasing solar production in recent years has created a trough in net electric load between the morning and evening peaks. (Source: https://www.eia.gov/todayinenergy/detail.php?id=32172.)
Using building energy code compliance incentives to encourage the adoption of residential batteries can mitigate the impact of the duck curve at the source: more batteries to soak up plentiful midday solar production, more batteries to serve the evening peak and to mitigate the steep ramp in early evening hours when solar production is going down and demand is rising as people turn on appliances in their homes. In addition, having the batteries on-site can help reduce wear-and-tear on distribution systems.